ORKG Workshop at the first German Open Science Festival
This is what happens when 23 Open Science Enthusiasts work together to make research machine-actionable
Science is facing a problem: Not only is a significant amount of knowledge still hidden behind paywalls, but in the ever-growing flood of publications, keeping an overview over relevant contributions is getting harder and harder. A new mode of scholarly communication is needed; one that is open and enables machine assistance for researchers.
The Open Research Knowledge Graph (ORKG) aims to provide a platform for open, machine-actionable knowledge from scholarly publications. In the ORKG, papers are described in a semantic manner, making them human- and machine-readable. This lets researchers explore knowledge in entirely new ways. One major challenge there is content curation, i.e. the question of who translates publications into a machine-readable form. AI often is too unreliable. The ORKG instead relies on curation by domain experts. Scientific communities create contents themselves.
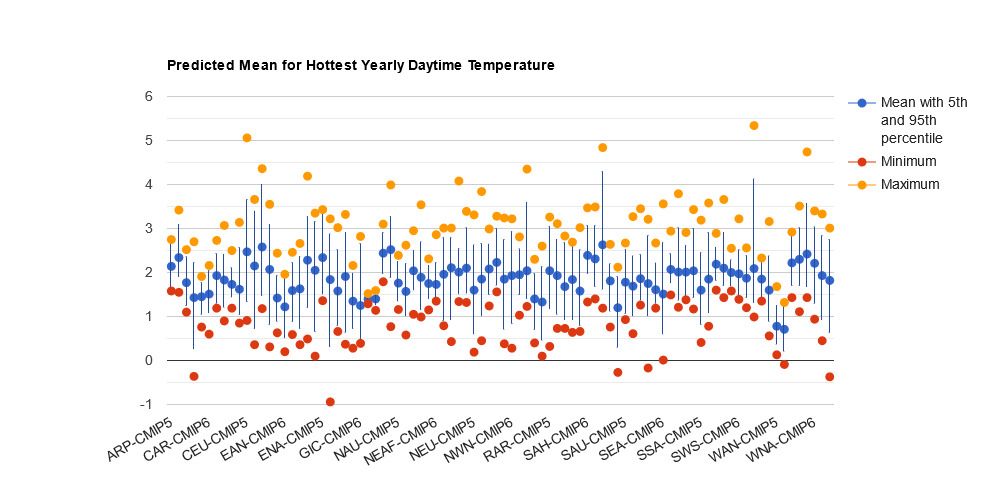
A little over a month ago, a little above 20 researchers came together to learn about this approach at an ORKG Workshop during the 1st German Open Science Festival. After an introduction to ORKG’s core concepts, we created a semantic description for a paper in the field of climate science. We entered the expected regional temperature changes for different regions based on the coupled model intercomparison project given in [1]. The result: https://orkg.org/paper/R209304. From this description, we semi-automatically created ORKG Comparisons, tabular overviews over different contributions. An example: Regional Differences of Temperature Extremes in CMIP5 – Comparison – ORKG shows the expected changes of the hottest daytime temperature based on the CMIP5. On top of the tabular view, the data has been visualized using ORKG’s visualization service. The same overview has been created for the CMIP6 results (Regional Differences of Temperature Extremes in CMIP6 – Comparison – ORKG) and for both results combined (Regional Differences of Temperature Extremes in CMIP5 and CMIP6 – Comparison – ORKG).

The data entered by the workshop participants can now be used in various ways, e.g. as input parameters for simulations, as a basis for reporting or to visualize the climate change impact in different regions.
Overall, the workshop showcases how it could look if a group of researchers, librarians and other open science enthusiasts work together to curate content and create machine-actionable descriptions.
[1] Seneviratne, S. I., & Hauser, M. (2020). Regional climate sensitivity of climate extremes in CMIP6 vs CMIP5 multi-model ensembles. Earth’s Future. 8, e2019EF001474. https://doi.org/10.1029/2019EF001474
Koordinatorin für Community Building und Training für den ORKG und NFDI4DataScience / Community Building and Training Coordinator for ORKG and NFDI4DataScience.
Post-doctoral researcher, data scientist, and lecturer with involvement in the research projects Open Research Knowledge Graph (ORKG), National Research Data Infrastructure for Engineering Sciences (NFDI-4Ing), and FAIR Data Spaces (FAIR-DS).


