Visualize the impact of your research – a customizable tool in the making
Metrics play an important role in research life. Hiring decisions or the evaluation of institutions or research groups are often based on a small number of indicators (e.g. the h-index). The underlying data is oftentimes opaque. To allow better decision making processes we need various, transparent and adaptable scientometric data and infrastructures. Data sources, data handling processes and visualisations must be transparent and open to everybody. Because the mentioned decisions can affect researchers strongly, it is important to consider the needs of the researchers themselves and allow customizations. Until now researchers have little to no influence on how scientometric indicators are reflected in researchers‘ profiles.
Addressing these needs, the ROSI project is involving researchers with interviews and workshops and developing a tool for customizable visualisations of open indicators based on their needs. The current tool allows visualisation, customization and configuration of indicators and data sources. The following will explain the features of the tool and give an outlook on future developments.
Visualisation
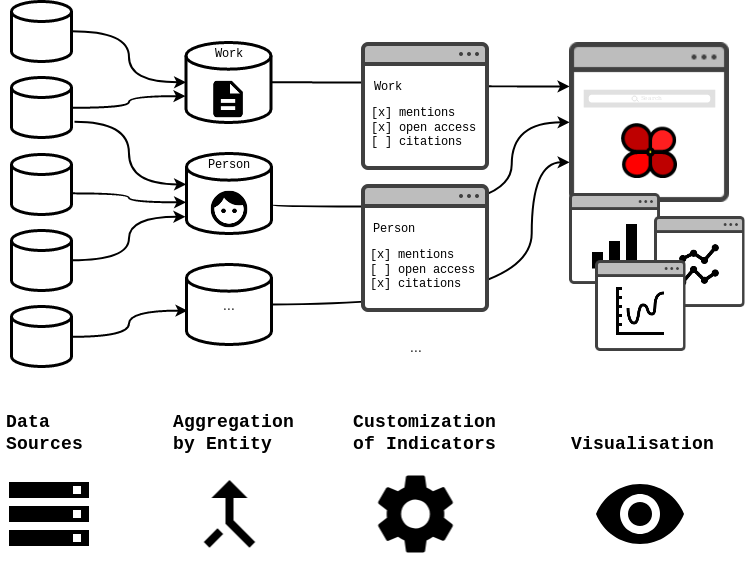
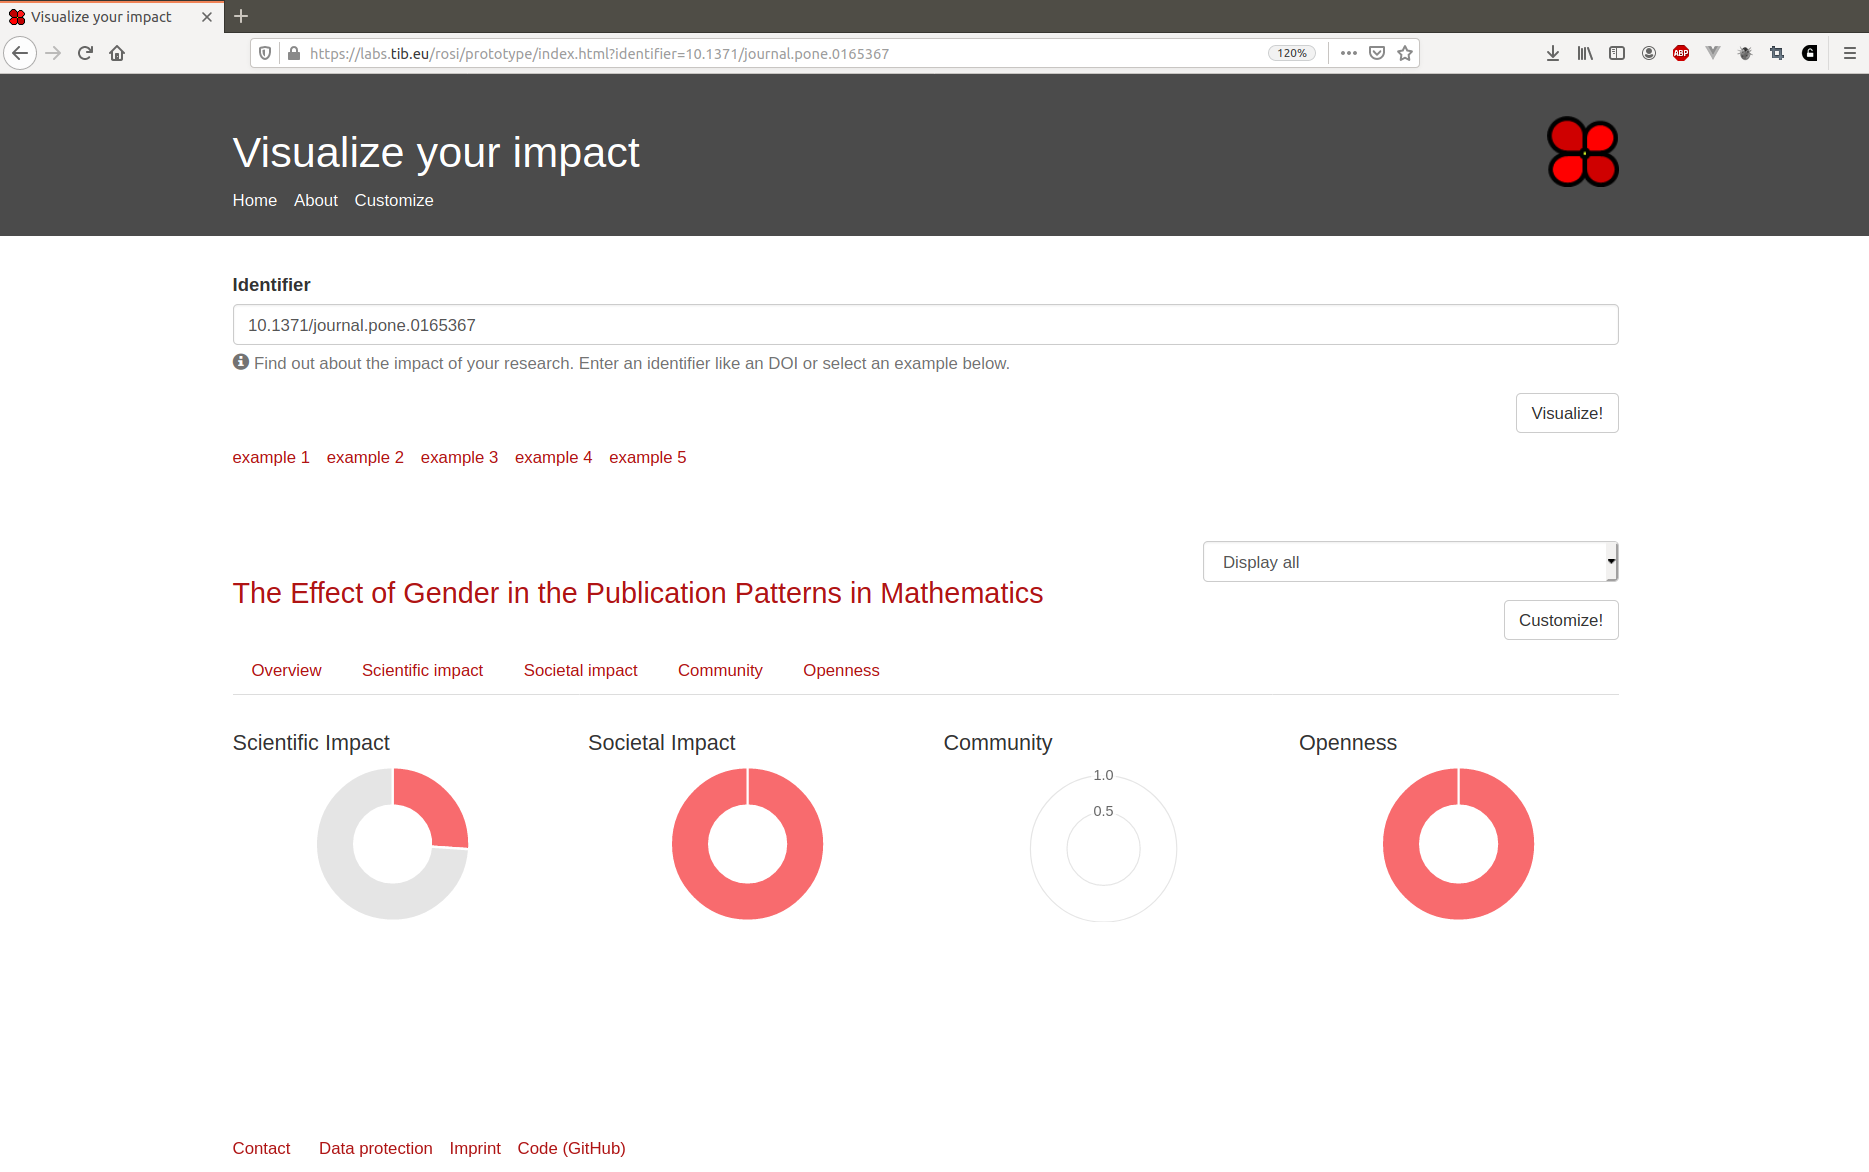
Scientific information about publications can be displayed by entering the persistent identifier of publications – currently the tool recognises only DOIs. The retrieved information is displayed in four areas:
- Scientific Impact – The impact within the scientific community; is mostly based on citation-based indicators,
- Societal Impact – Recognition from societal groups or for societal activities; measurable impact e.g via patents, citations in policy documents, mentions in (social) media (e.g. Wikipedia mentions),
- Community – Involvement in the scientific community (e.g. activities on StackExchange) and
- Openness – Compliance to Open Science Standards (e.g. open access publication).
The overview displays a selection of indicators for each concept – to get a first impression. More details can be seen in the corresponding tabs.
Customization
As data sources for indicators may be valued differently – for example some would maybe not consider Twitter data as valuable and others might find it useful – the tool gives the option to select or deselect indicators that will be displayed. Users can select between stored customizations, see their descriptions and also create new ones (click on the following image to see a screencast of the customization feature).
Configuration
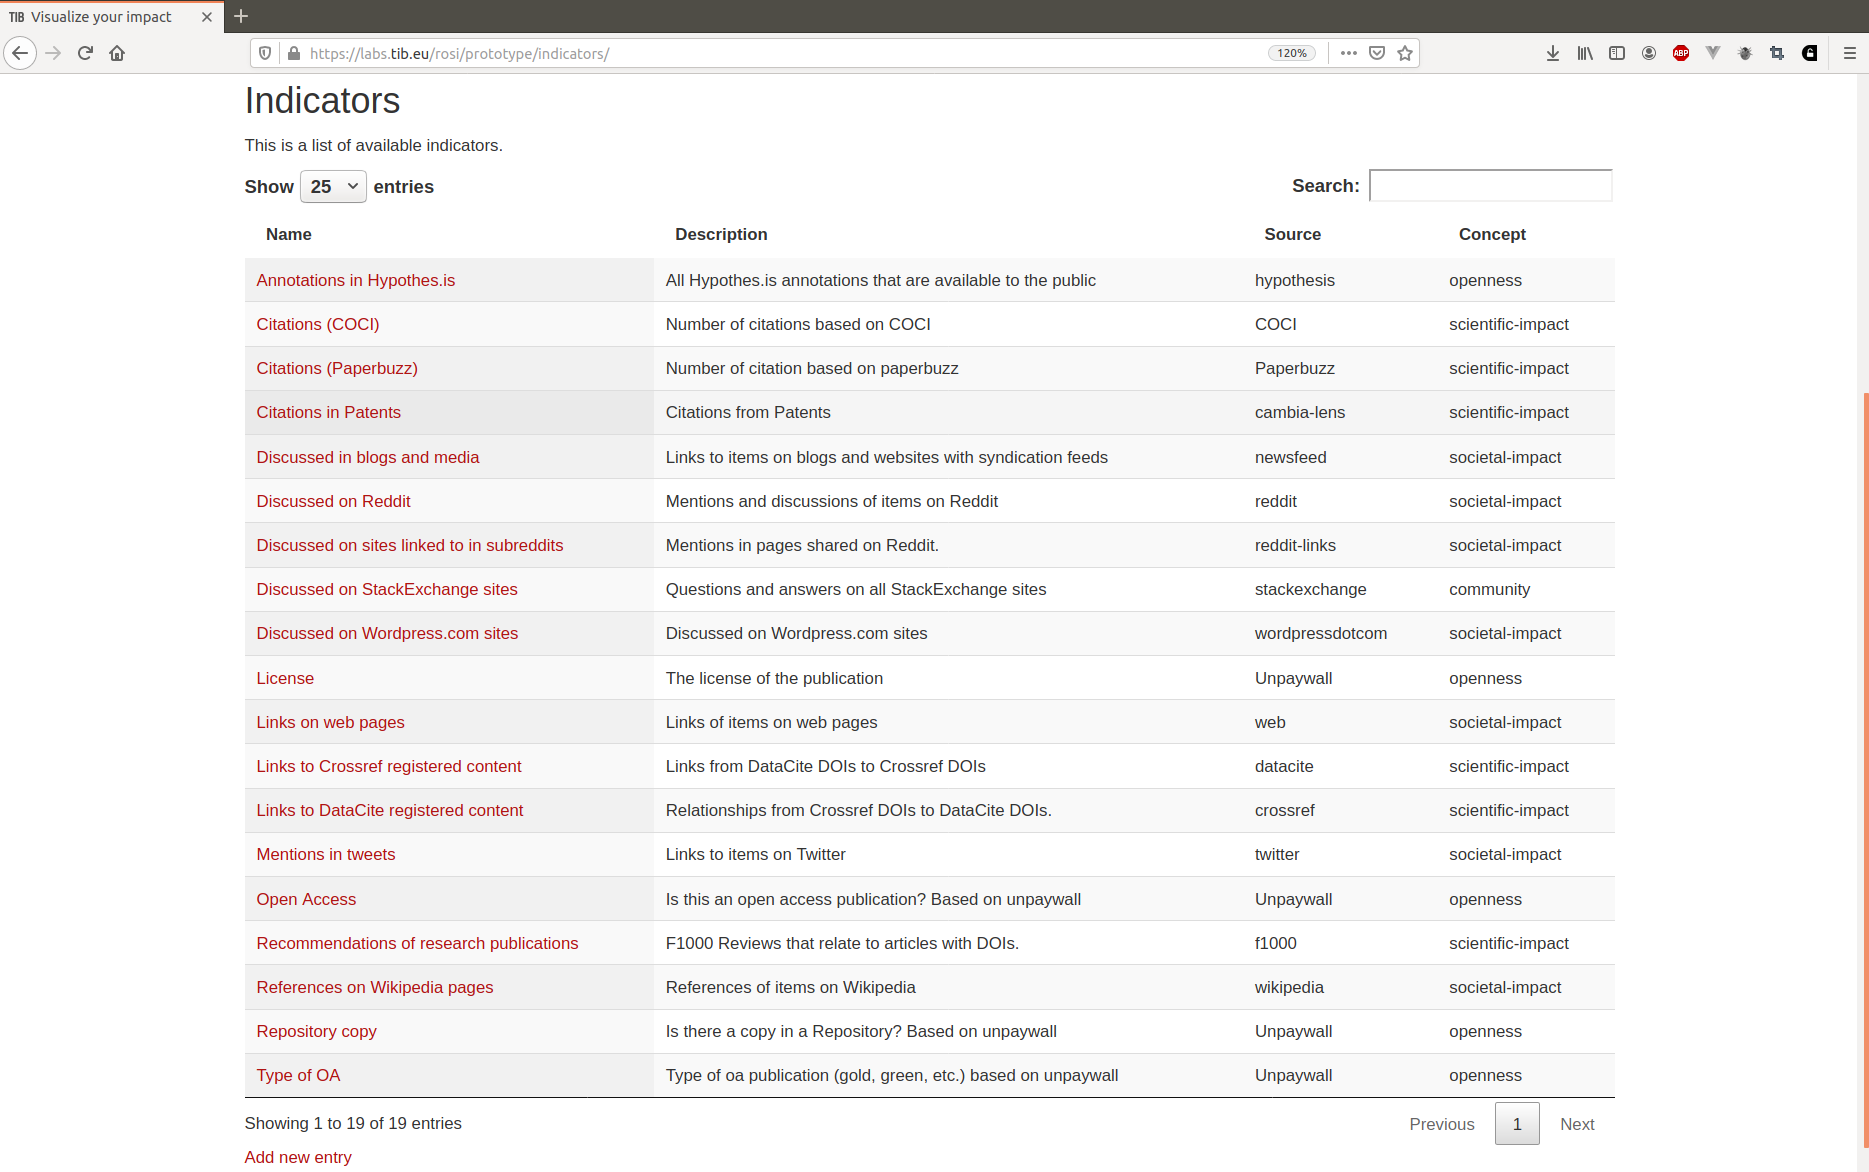
All indicators that are being displayed at the visualisation interface are described in a public list (see image x). At this place administrators can change indicators and also add new ones. Data sources need to have an open interface. The tool will automatically retrieve the information (defined in „Key/s“) and display it in the selected concept. To find out more about the technical implementation of the tool, have a look at the GitHub repository.
Outlook
To display the collected scientometric information at a place, where researchers can easily access it, we are working on an integration in the TIB research information system (RIS). The data will be displayed directly at the RIS profiles of the researchers.
Your opinion counts!
Would you like to give input on how your profile should be enhanced with scientometric data? Contact us if you would like to help us improve our tool in participating in our next workshop: rosi.project@tib.eu
0 Antworten auf “Visualize the impact of your research – a customizable tool in the making”