A step towards open research analytics with UMBIKO
Research organizations of any kind continuously accumulate huge collections of varied formatted data stored in heterogeneous forms for different purposes. However, it is uncommon that analytics on the collected data sets are readily available. This makes it extremely difficult for researchers or research administration to analyze or even filter the data into subsets. Often researchers might end up spending weeks or months of working hours on repeating similar pre-processing steps to answer simple analytical questions. Also, with more and more research information being available in institutes, there is a need to provide curated reporting and predictions on research information.
Currently, either institutes generate reports manually (investing too many work hours) or use commercial products (resulting in high costs). Big institutes usually have the funds to pay for commercial services, but they remain dependent on the commercial organizations for any changes that they may require in their systems. On the contrary, small to medium sized institutes might not hold funds either to pay for commercial services or employ people for manual analytics and reporting on information research.
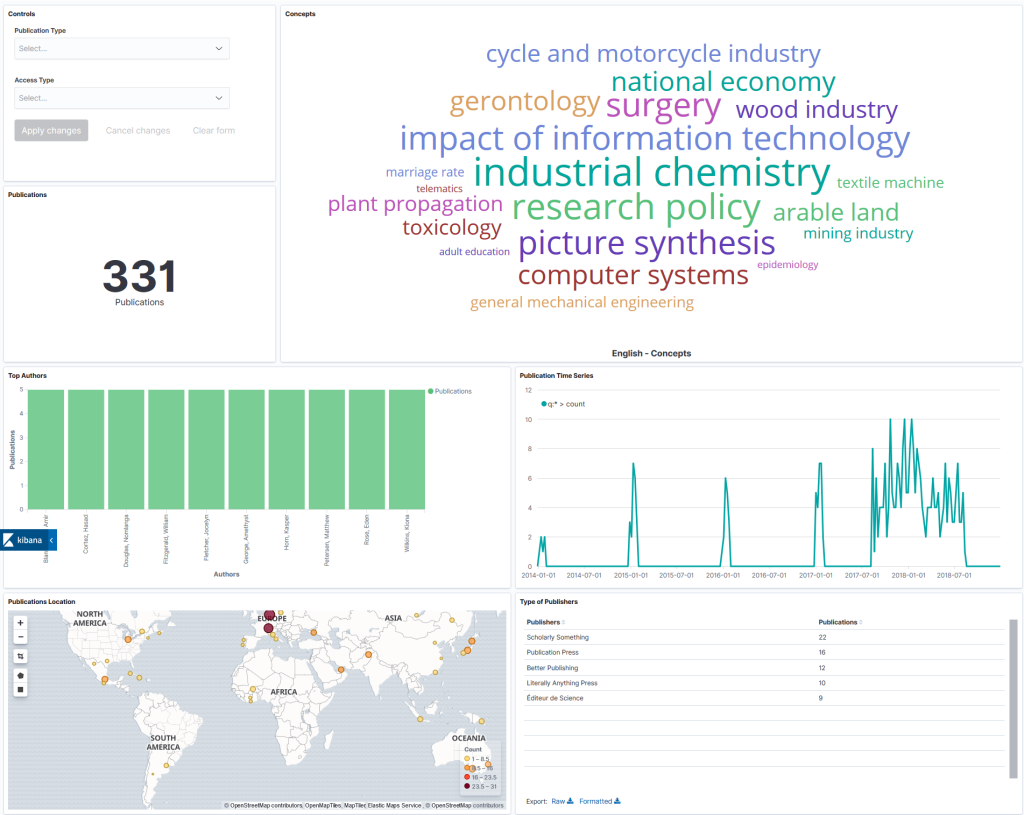
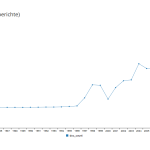
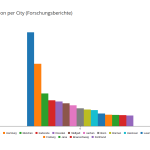
The Umbiko prototype is initiated to tackle challenges in the area of providing on-the-go analytics and reporting on research information, from current research information systems (CRIS) such as VIVO, and some of the corpora that TIB currently maintains. The prototype is based on the open-source search engine Elasticsearch and the open source analytics and visualization tool Kibana. With Umbiko, once the data from a corpus or CRIS is indexed in the Elasticsearch, customised interactive dashboards can be designed within minutes and exported to other systems. For additional visualizations, Umbiko also provides a proxy API over Elasticsearch, with which any customised search query could be fulfiled and visualizations could be easily created via any visualization library. For demonstration purposes Umbiko used the javascript library C3 to create some example visualizations.
Where are we going now? This prototype was developed in a side effort of our VIVO activities. In the future, we will incorporate the findings gained in this context into various projects in order to make research information usable and analyzable for a wider audience. No matter whether it is scientometric investigations or decision support for research administration: The analysis of research information should be simpler than is currently the case. We hope to be able to take a small step in this direction with Umbiko.

Software Engineer in the Open Science Lab of the TIB